Welcome to SomaMutDB!
A database of somatic mutations in normal human tissues
- 1 Tutorial
- 1.1 Browse
- 1.2 Search
- 1.3 Signature Analysis
- 1.4 Pathogenic Prediction
- 1.5 Download
- 2 FAQ
- 3 Contact
1 Tutorial
All variants (SNVs and INDELs) are displayed on the human reference genome using Jbrowse2.
The default session of Jbrowse2 will show variants close to the NOTCH1 gene for the transverse colon (label of track: Colon__Transverse Somatic Mutatiion; top: hg19/GRCh37; bottom: hg38/GRCh38). The track selector for tissues could be opened through the buttons in the top left.
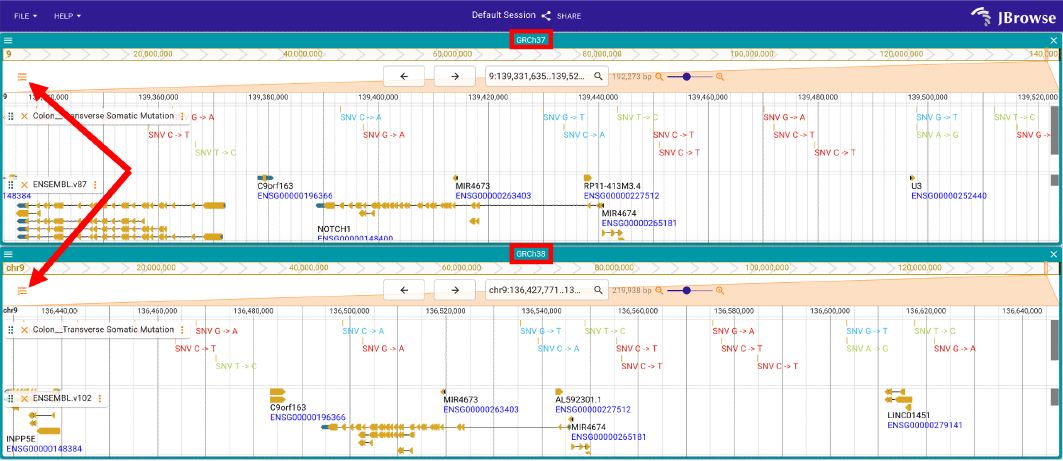
Figure 1
The user could also start a new window for browsing using the menu bar: File -> Add -> Linear genome view. In the new window, the user needs to select the preferred genome build in the ‘Assembly’ frame and the desired chromosome in ‘Sequence’ frame, and then click ‘OPEN’ (Figure 2).
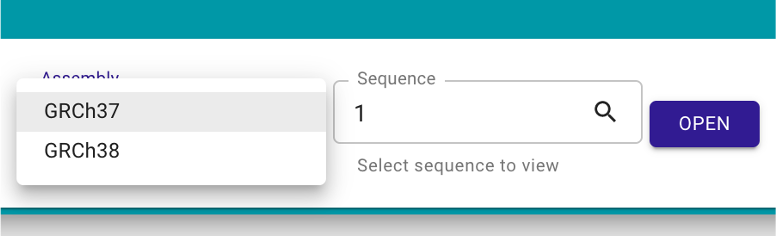
Figure 2
Then, click ‘OPEN TRACK SELECTOR’ (Figure 3) and check any data the user would like to show in the browser (Figure 4). Here, we provide annotations of gene and regulatory elements from EMBL and GENCODE, and median expression level (TPM values) in GTEx 54 tissues.
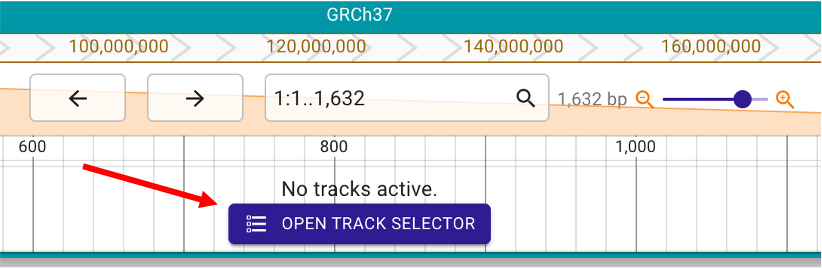
Figure 3
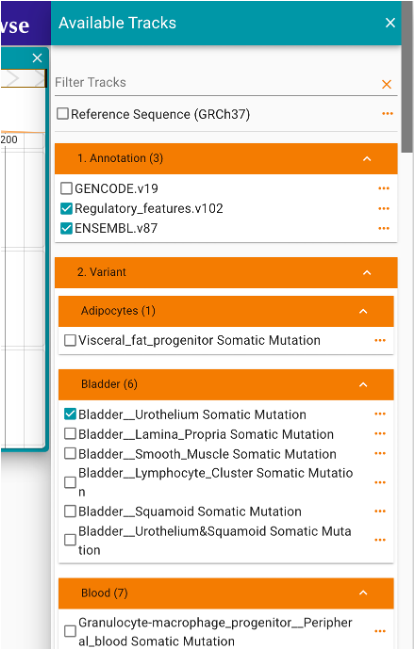
Figure 4
Like Figure 5, the user could check the mutations and related gene and regulatory annotations. Further, the samples covering the selected mutation could be observed in the right panel of Jbrowse after clicking any mutation of interest.
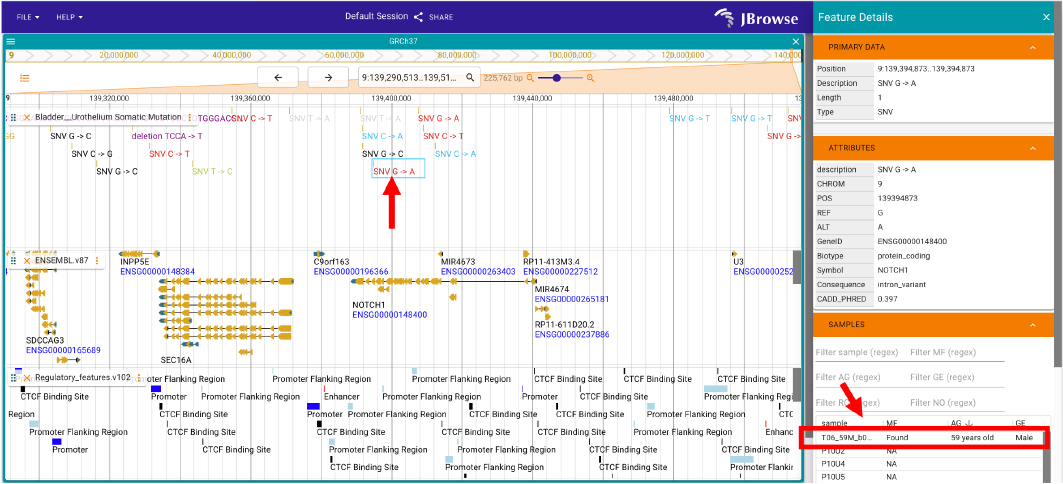
Figure 5
To select all variant tracks, user could download these two session files for hg19/GRCh37 and hg38/GRCh38. Then use the menu bar File -> Import session and put the session file into new window (Figure 6). Finally, the browser will show somatic mutations with all somatic mutation track selected.
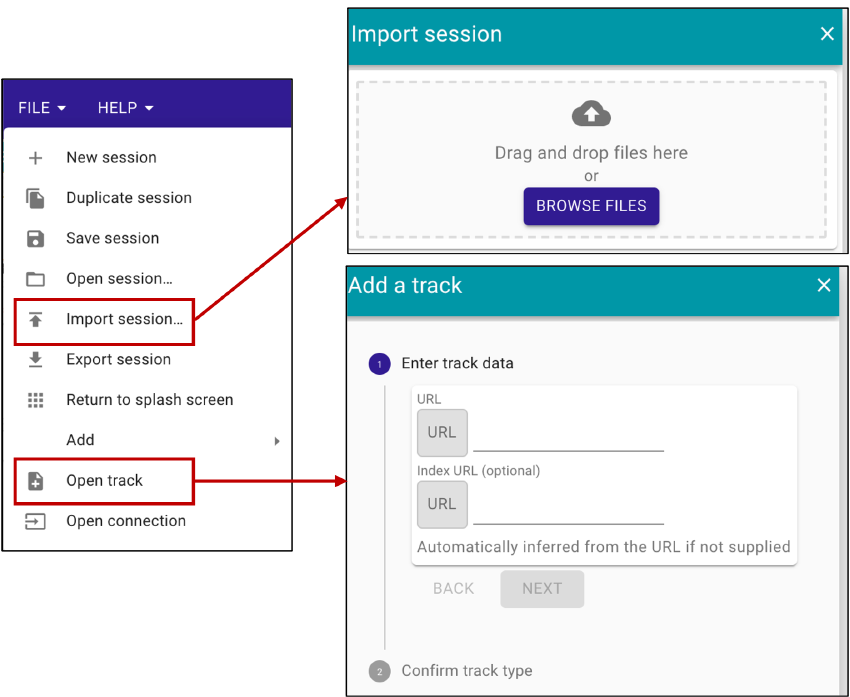
Figure 6
To compare users’ somatic mutations with those stored in the SomaMutDB, users can use the menu bar File -> Open track (Figure 6). Then, the URL to the data file and corresponding index file need be filled in the new window. After clicking the ‘NEXT’ and ‘ADD’ buttons, the user’s somatic mutation will be shown in the Jbrowse2.
Specially, the URL of the users’ data must be accessible to SomaMutDB, e.g., from Amazon S3, Google cloud storage, or ftp server. Here is an example how to prepare the data in Amazon S3. Users could create new bucket in Amazon S3 and uncheck the box for “Block all public access”. Then, revise the context of CORS (Cross-origin resource sharing) in “Permissions” of the bucket with this JSON file. Next, users need upload their data and change the permissions of data to public access. Finally, the URL started with “https” could be used for Jbrowse in SomaMutDB.
Here is another example URL from NCBI for testing:
https://ftp.ncbi.nlm.nih.gov/pub/dbVar/data/Homo_sapiens/by_study/vcf/nstd175.GRCh37.variant_call.vcf.gz
https://ftp.ncbi.nlm.nih.gov/pub/dbVar/data/Homo_sapiens/by_study/vcf/nstd175.GRCh37.variant_call.vcf.gz.tbi
We annotated our collection of variants with VEP and CADD. The results in ‘Search’ will show not only basic information of each variant, e.g., tissue, sex and age, but also the possible variant’s consequence for the gene. We also present functional impact and deleterious scores from SIFT, PolyPhen and CADD. If the variant is located within regulatory elements, we will show regulatory types and its ENSEMBL ID. All the above information can be hidden or displayed through the settings after clicking the gear icon (Figure 7). In our database, we provide several ways to search the variants and their annotations.
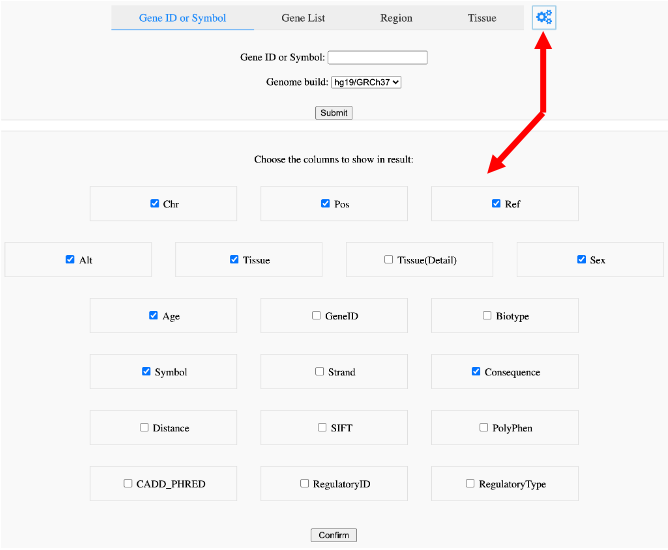
Figure 7
Search by gene ENSEMBL ID or symbol (Figure 8). The user can enter a single gene or gene list here. The resulting table will show in the bottom of the web page and can be sorted according to any column. This example of a search result only presents chromosome, position, reference base, allele base, tissue, sex, age, co-located gene and consequence of a variant. The results can be downloaded by clicking the ‘Download’ button, which is highly encouraged if too many variants are obtained. The downloaded file is a tab-separated values file available for any text editors.
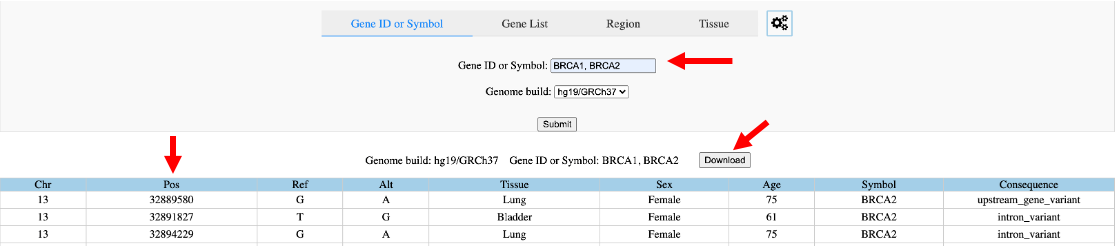
Figure 8
Search by special gene list (Figure 9). Currently, we only provide gene lists related with aging, cell senescence, DNA repair, transcription factors and cancer driver genes (cancer gene census). User could also upload the interest gene list to the database for browsing.
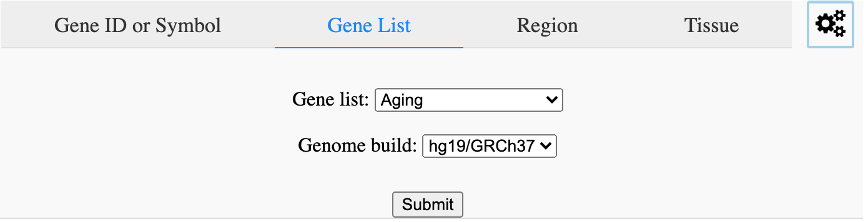
Figure 9
Search variants in specific chromosomal regions (Figure 10). Select chromosome and input start and end positions for search.
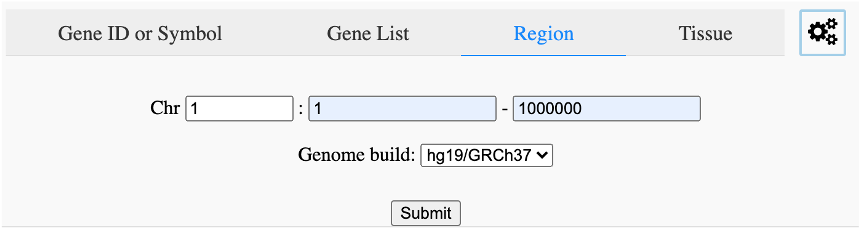
Figure 10
Search by tissue (Figure 11).
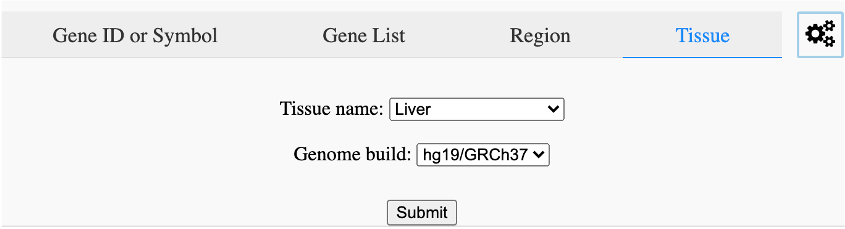
Figure 11
Search by sequencing type, scope or depth (Figure 12).
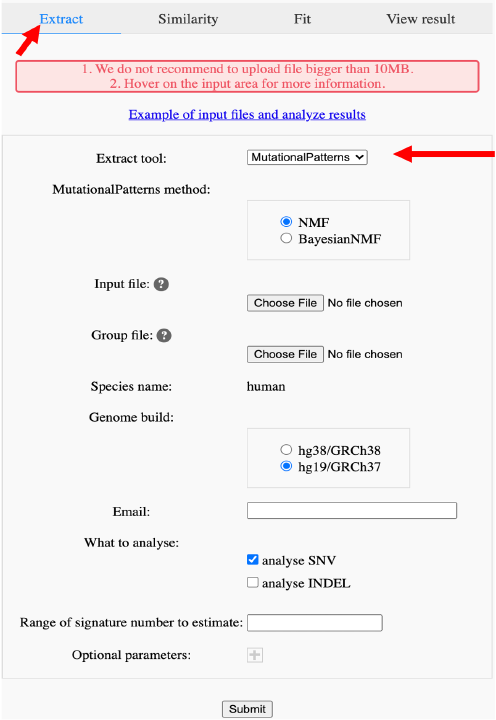
Figure 12
We provide six tools in mutation signature extraction, cosine similarity and fit analyses to help you analyze your data.
| MutationalPatterns | SomaticSignatures | hdp | signature_tools_lib | Sigprofiler | mmsig | |
|---|---|---|---|---|---|---|
| Extract | √ | √ | √ | √ | √ | |
| Similarity | √ | |||||
| Fit | √ | √ | √ | √ |
For analysis, you need to first select the type of analysis and then choose one tool for analysis (Figure 13). All information except optional parameters is required. We have provided default values for all parameters. If you wish to know the meaning of parameters, just hover over the text field and support will come out in seconds. For extraction tools except hdp, you can provide 2:2 in ‘Range of signature number to estimate’ to force extraction tools providing results with only two signatures.
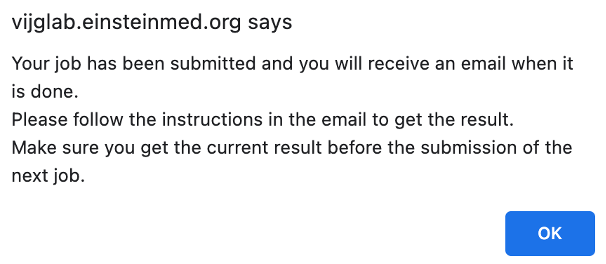
Figure 13
After clicking ‘Submit’, a pop-up window will notice that the job is submitted (Figure 14). You will receive the confirmation email and get another email when your job is completed.
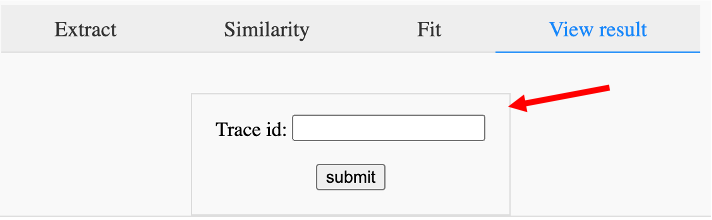
Figure 14
With the link in the email, you could download all results. Alternatively, you could quickly check the figures of your result in ‘View result’ page with the id in your received email (Figure 15).

Figure 15
Here are examples for preparing the files that need to be uploaded. Please check the README first for the details of required upload files. The files with the prefix 'test_small' in their names are the example files for somatic mutations. Also, we provide the example results using upload example files listed in the README.
Of note, this function is only supported in the server https://somamutdb.org/SomaMutDB/
We provide 24 pathogenic prediction models and 1 gene expression prediction model for users to run their own mutations through.
| Group | Models |
|---|---|
| Protein/Sequence Impact Models | AlphaMissense DEOGEN2 Eigen (coding) MPC M-CAP REVEL PrimateAI EVE FATHMM Coding |
| Regulatory/Non-Coding Impact Models | FATHMM Non-Coding LIST-S2 GenoCanyon FINSURF Eigen PC Raw |
| Meta-Predictors (Integrated Scores) | BayesDel AddAF BayesDel NoAF MutationTaster MetaLR MetaRNN MetaSVM CADD DANN MVP CanDrA |
| Gene Expression Predictors | ExPecto |
For Pathogenic Prediction, users may either insert their mutations into the textbox or upload a file of their mutations (Figure 16). We require users to provide the chromosome number, the position, the reference base, and the alternative base of the mutation. Following this the genome build should be selected.

Figure 16
After clicking ‘Submit’, a pop-up window will notice that the job is submitted (Figure 14). You will receive the confirmation email and get another email when your job is completed.
In the results table the scores for the uploaded mutations will be displayed, and predictions are color-coded by model category: PIMs, RNIMs, and MPs (Figure 17). Different categories may be in contradiction: e.g., a PIM might predict structural damage while an RNIM shows benign regulatory impact, suggesting the mutation is structurally pathogenic but transcriptionally neutral, or you can use Meta-Predictors (MPs) for an integrated assessment across multiple models. For every mutation that is compatible with FINSURF or obtained scores from a model with an associated score denisty plot there will be a dropdown arrow in the 'graphics' column.
Click the dropdown arrow to display the FINSURF contribution plot and the model's score-density plot overlaid with the mutation’s score (Figure 17 (continued)).
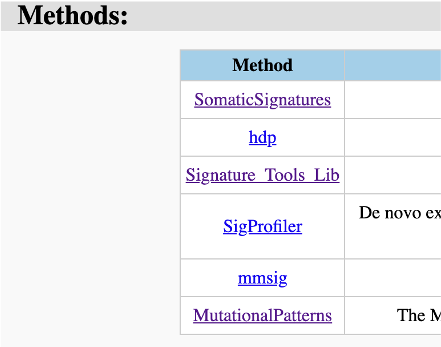
Figure 17
Figure 17 (continued)
At the bottom of the page will be a page navigator, where more pathogenic scores or ExPecto results can be reached (Figure 18).
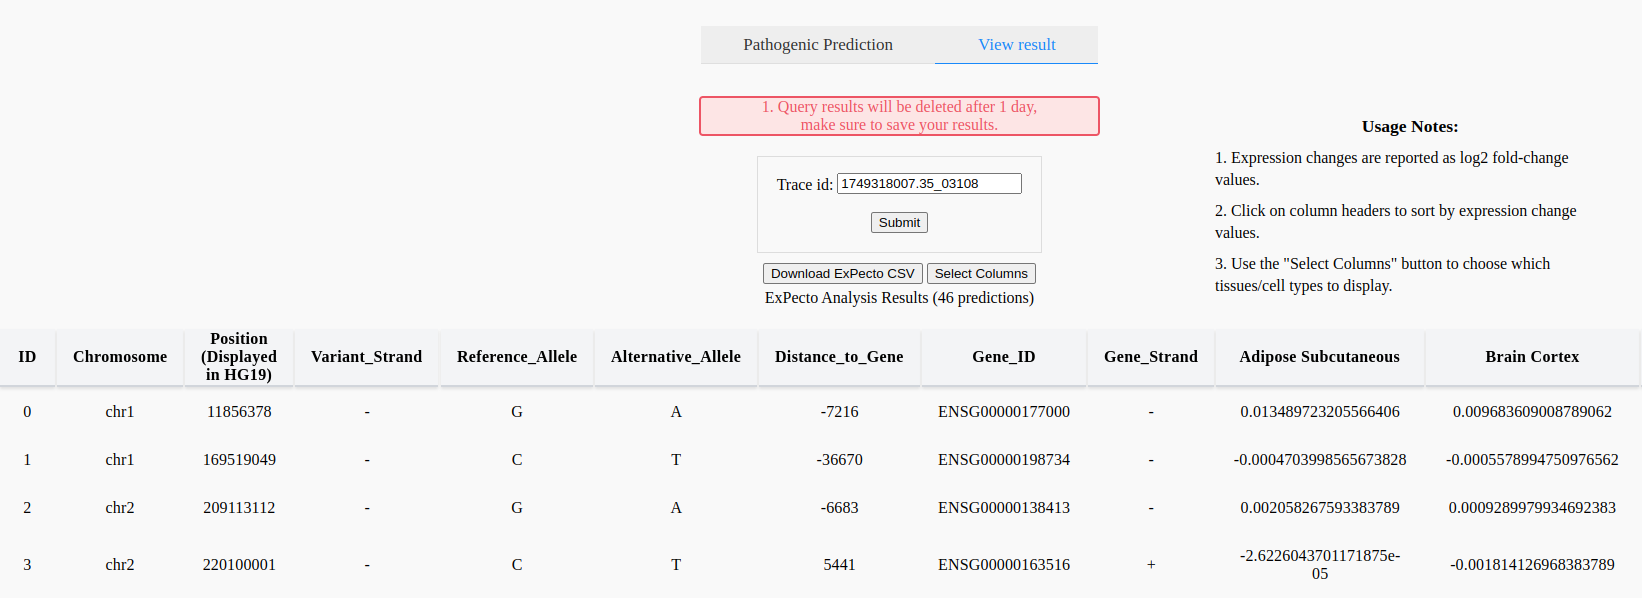
Figure 18
The ExPecto tool predicts tissue-specific expression changes caused by mutations, reporting the effect on the nearest gene as log2 fold change values (Figure 19).
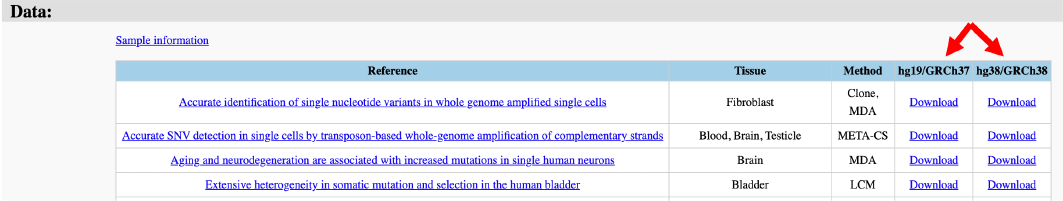
Figure 19
We provide links of the variant data, publicly available mutational signatures, signature analysis tools, and pathogenic prediction tools.
First, we sort all variants in vcf format and compressed files according to the references (Figure 20).

Figure 20
Then, we collect two publicly available mutational signature datasets for users (Figure 21). For Signal signatures in hg38/GRCh38, we adjusted the signatures based on the ratio of trinucleotides frequencies in hg38/GRCh38 and hg19/GRCh37.
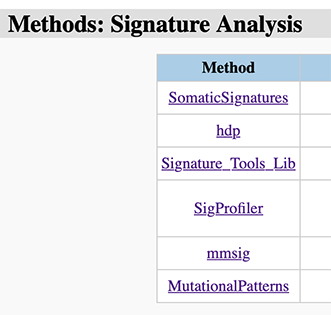
Figure 21
Next, all used signature analysis tools could be checked by the links to their github repositories (Figure 22).
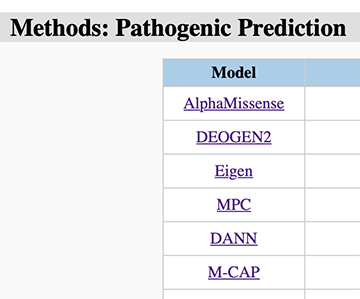
Figure 22
Finally, all used pathogenic analysis tools used can be referenced through links to their websites, github repositories, or original publications (Figure 23).

Figure 23
2 FAQ
1 Do I need to register an account to do the analysis?
Answer: You do not need an account. But we do need your email address to send you the link of the analysis' result.2 Where did you obtain the gene lists for Search?
Answer: Here are the links for the gene list: aging (https://genomics.senescence.info/genes/index.html), cell senescence (https://genomics.senescence.info/cells/), DNA repair (https://www.mdanderson.org/documents/Labs/Wood-Laboratory/human-dna-repair-genes.html), transcription factor (https://en.wikipedia.org/wiki/List_of_human_transcription_factors), cancer gene census (https://cancer.sanger.ac.uk/cosmic).3 Could you show your pipeline for read-alignment and somatic mutation calling in MDA samples?
Answer: Adapter and low-quality reads are trimmed by Trim Galore (version 0.6.4). The trimmed reads are aligned to the human reference genome (GRCh37 with decoy or GRCh38) by BWA mem (version 0.7.17). Duplications are removed using samtools (version 1.9). The known indels (1000 Genomes Project, phase 1) and SNPs (dbSNP) are downloaded from public GATK Google bucket (https://console.cloud.google.com/storage/browser/gcp-public-data--broad-references). The reads around known indels are local-realigned and base quality scores recalibrated based on known indels and single nucleotide variants via the Genome Analysis Toolkit (GATK, version 3.5.0). The heterozygous SNVs and INDELs are then identified in the bulk whole genome sequences using Haplotypecaller of GATK (GATK quality score ≥30, ≥20× depth and with dbSNP annotation). Somatic mutations are identified using SCcaller (version 2.0.0) at ≥20× (SNVs) and ≥30× (INDELS) sequencing depth, with INDEL quality score ≥25. Any mutations annotated in dbSNP are removed.4 What are the differences between the different signature analysis methods?
Answer: MutationalPatterns provides a comprehensive set of flexible functions that allows researchers to easily evaluate and visualize a multitude of mutational patterns. It does the extraction process using non-negative matrix factorization (NMF) and Bayesian NMF. The data are fitted by non-negative least squares (NNLS) or strict fit (by removing least contributing signatures). User can also do bootstrapped fitting on their data based on the above two methods. MutationalPatterns also provides other functions like cosine similarity comparison between signatures.SomaticSignatures is a flexible and efficient tool for inferring characteristics of mutational mechanisms. It extracts mutation signatures by NMF or principal component analysis (PCA).
hdp is a tool to use the hierarchical Bayesian Dirichlet process, either de novo or with reference signatures (‘priors’). It initializes a hierarchical Dirichlet Process of any shape of categorical count data, perform Gibbs sampling of the posterior distribution, and analyze the output. The number of signatures will be automated decided by tool. With prior signatures, hdp will discover new signatures besides the known ones.
Signature_tools_lib is a tool providing the latest algorithms for signature fit and extraction. There are three NMF optimization algorithms available for extraction, including Kullback-Leibler divergence (KLD; brunet), Frobenius norm (lee) and nonsmooth NMF (nsNMF) algorithms, and three fitting methods including KLD, NNLS, and simulated annealing (SA). This tool allows forcing of prior signatures in the extraction analysis. It is already applied in the Signal database, which provides reference mutational signatures for primary cancers of 21 human organs.
SigProfiler is an automated tool for accurate de novo extraction of mutational signatures for all types of somatic mutations. It performs automatic selection of the number of signatures from NMF and decomposes de novo extracted signatures to known COSMIC signatures with the NNLS algorithm. This tool is used to generate reference mutational signatures from cancer genomes and exomes in the COSMIC database.
mmsig is a tool only designed for signature fitting. It estimates the contributions of the reference mutational signatures in each sample employing an expectation maximization algorithm and removes signatures with the least contribution in each iteration. In our database, we customized the original R script to include the analysis function for INDEL.
5 How do you annotate the mutations? Where did you get the mutations in GRCh38?
Answer: We annotated mutations using VEP (Ensembl v102) and CADD (v1.6). For each variant, we selected one consequence of all candidate annotations by setting pick_order as “rank,biotype,mane,tsl,appris,length” in VEP. The mutations in hg19/GRCh37 are lifted to hg38/GRCh38 under CrossMap (v0.5.2). Variants not fully mapped to chromosomes 1-22, X and Y in hg38/GRCh38 are not included in the results.6 What are the differences between the various methods for single cell analysis, i.e., SCMDA, G&T-seq, META-CS, Clonal outgrowth, LCM, PTA)?
Answer: Multiple-displacement amplification (MDA) is one of multiple whole genome amplification (WGA) methods. It employs a strand-displacing DNA polymerase to exponentially amplify single-stranded DNA from only one single cell. It has higher sensitivity and accuracy in detecting small variants than other WGA methods. The major disadvantage of MDA is allelic dropout and amplification bias, which can lead to false positive mutations. Most such artifacts are filtered out by some calling strategies, such as SCcaller and LiRA.Genome and transcriptome sequencing (G&T-seq) is a method for separating and sequencing genomic DNA and full-length mRNA from same single cells. The genomic DNA is amplified using MDA, while mRNA is amplified using the Smart-seq2 method.
Multiplexed end-tagging amplification of complementary strands (META-CS) is a single-cell whole-genome amplification method that leverages the complementarity of the two strands from double-stranded DNA to achieve accurate SNV identification. It can be used for haploid cells and can call SNVs at lower sequencing depth than MDA. The disadvantages are that the sensitivity of META-CS is not as high as that of MDA, and currently only SNV calling, not INDEL calling is available for META-CS.
‘Clone’ here means in vitro clonal expansion of a single cell prior to sequencing. The advantage of this method is that you can use bulk sequencing and routine analysis pipelines on these single cell clones. However, only the cells that are able to proliferate in vitro (e.g., stem/progenitor cells or reprogrammed cells) can be studied. Further, the culturing procedure may introduce artifacts.
Laser-capture microdissection (LCM) is a method allowing whole-genome sequencing of small cell populations (~100-1000 cells) for which precise phenotypic and spatial information is preserved. These cells can be considered as in vivo clonal expansion from one stem cell.
Primary template-directed amplification (PTA), unlike MDA, incorporates the exonuclease-resistant terminators into the reaction, creating small double-stranded amplification products that undergo limited subsequent amplification. This transforms the reaction from exponential into a quasilinear process, with more of the amplification occurring from the primary template. PTA has improved and reproducible genome coverage breadth and uniformity, as well as diminished allelic skewing. PTA has the potential to enable structural variant detection in single cells. However, it still generates hundreds to thousands of false-positive single base substitutions and indels in each amplification reaction.
7 Could we do analysis on whole exome sequencing (WES) data?
Answer: Yes, you could do signature analysis of whole exome sequencing data. However, you need to be careful with any SNV signatures uploaded for analysis. For example, the SNV signatures in our download page are generated from whole genome sequencing (WGS) data. As the frequencies of the trinucleotides in whole genome and whole exome are different, you may need to adjust your SNV matrix to whole genome trinucleotide frequencies or SNV signatures to whole exome trinucleotide frequencies. Here is a simple Rscript for adjustment.8 Does signature analysis process double base substitutions (DBS) data?
Answer: Currently, we only focus on SNVs and small INDELs. Some DBS are splitted into SNVs.9 What are the NanoSeq and SMM-Seq?
Answer: Both methods are prepared in bulk cells, but provide the mutations at the single molecule resolution.Nanorate sequencing (NanoSeq) is a duplex sequencing protocol with error rates of less than five errors per billion base pairs in single DNA molecules from cell populations. Its accuracy basically depends on sequencing copies of both strands of a DNA molecule. Further, NanoSeq applied different restriction enzyme to avoiding end repair and introduced non-A dideoxynucleotides to blocking nick extension. NanoSeq could be applied on any tissues, including sperm.
Single Molecule Mutation Sequencing (SMM-Seq) for the accurate cost-effective assessment of somatic single nucleotide variants (SNVs) in bulk DNA extracted from normal cells and tissues. It utilized Rolling Circle-based linear amplification to produce single-stranded DNA molecules which composed of multiple concatemerized copies of equally represented DNA strands of each particular DNA fragment. It provided higher accuracy in avoiding sequencing and amplification errors rate as multiple independent copies of DNA fragment obtained in the data. It is less resource demanded compared with single cell methods.
10 Do you have VCF files for the “abnormal” samples in these papers?
Answer: Yes, we also preprocessed their mutations (excluding tumor samples). Here are the sample information and VCF files (hg19/GRCh37 and hg38/GRCh38).3 Contact
Jan Vijg, Shixiang Sun, Xiao Dong
Email: somasc2024@gmail.com; somamutdb@gmail.com
Address:
Albert Einstein College of Medicine
Michael F. Price Center
1301 Morris Park Avenue, Room 450
Bronx, NY 10461
Jan Vijg's lab©2025 The Dong Lab, MIBAM, University of Minnesota. All rights reserved.